
![]()
 |
 |
 |
 |
 |
 |
 |
 |
 |
 |
 |
 |
 |
 |
 |
 |
 |
 |
 |
 |
 |
 |
 |
 |
 |
 |
 |
- Introduction
- Key Features
- Installation
- Initial Configuration
- Using the Plugin
- Authenticated API Configuration (Optional)
- Troubleshooting
- Credits
- License
Foreca One Weather Forecast is a comprehensive Enigma2 plugin that provides detailed weather forecasts for up to 10 days using public data from Foreca. With an intuitive interface and extensive customization options, you can always keep an eye on the weather directly from your receiver. The plugin now also includes a complete lunar calendar with precise astronomical calculations and a new live radar viewer based on RainViewer data.
- Free mode – uses public Foreca endpoints and scraping for most features.
- API mode – unlocks live maps, observation stations, and more with a free 30‑day trial.
- Current conditions with extended details:
- Temperature, feels like, dew point
- Wind (speed, gusts, direction)
- Humidity, pressure, UV index, AQI
- Rain/snow probability and amount
- Last update time
- 10‑day daily forecast (min/max temp, wind, precipitation, weather symbol)
- Hourly forecast for the selected day (scrollable list with icons)
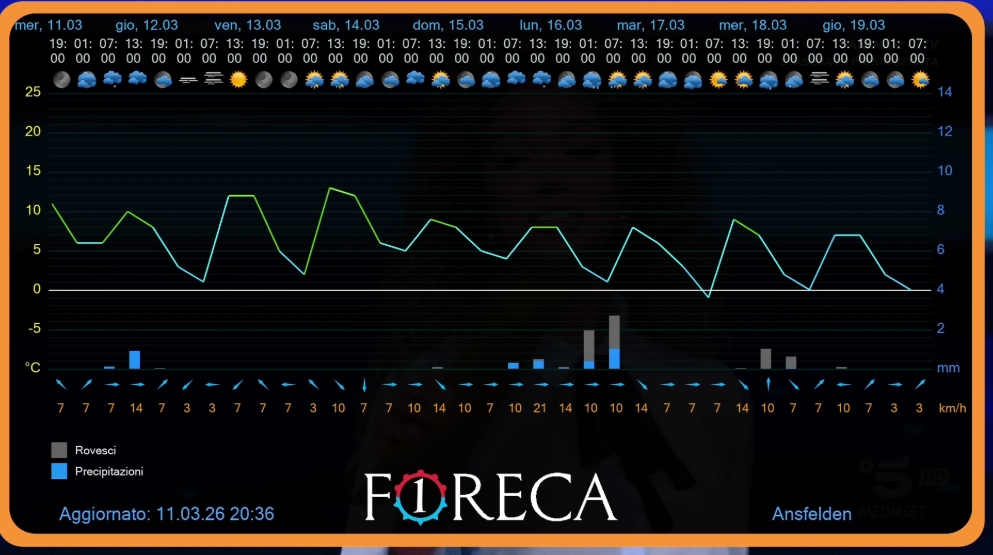
- 7‑day meteogram – temperature curve, rain bars, icons and wind
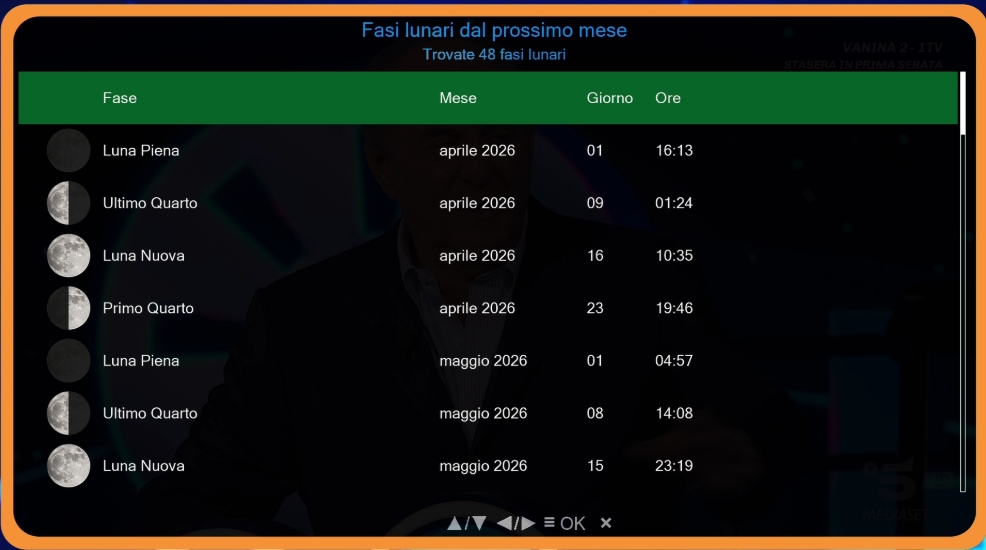
- Lunar Calendar – a dedicated screen showing all lunar phases for the next 12 months
- For each phase: date, time, phase name, illumination, Earth‑Moon distance, and the corresponding icon
- Accurate calculations based on Meeus algorithms, fallback to USNO API
- Moon phase with icon on main screen
- Moonrise and moonset times (from USNO API, async)
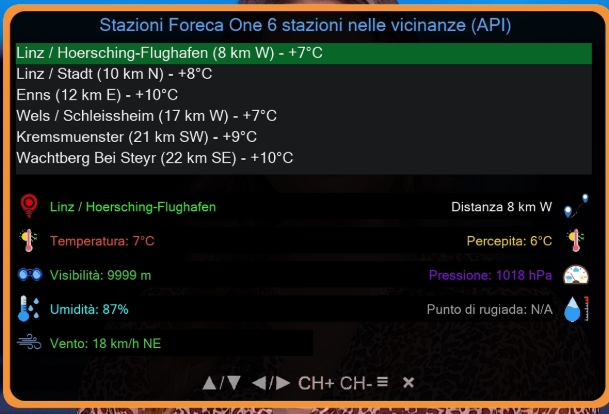
- Nearby stations (from authenticated API or scraping)
- Temperature, feels like, humidity, pressure, wind, visibility
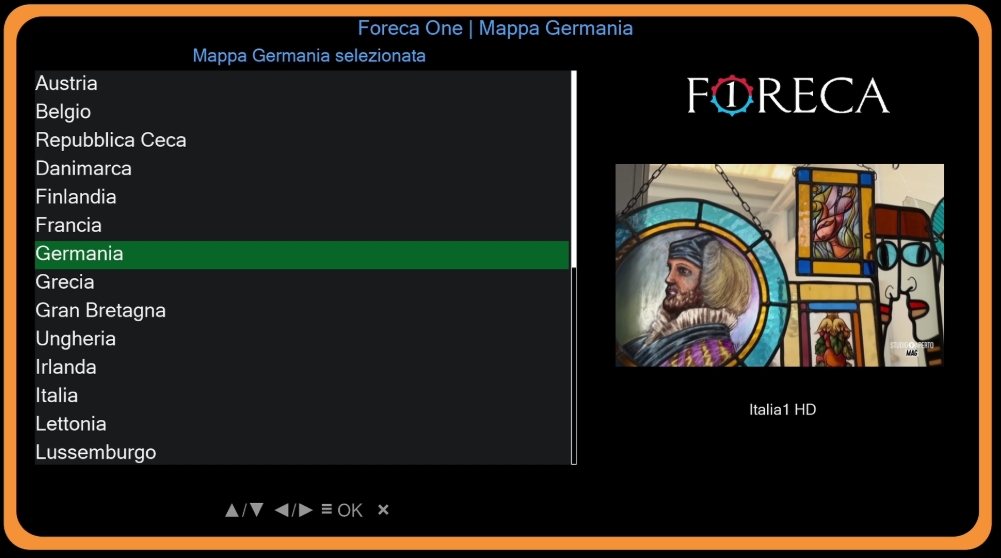
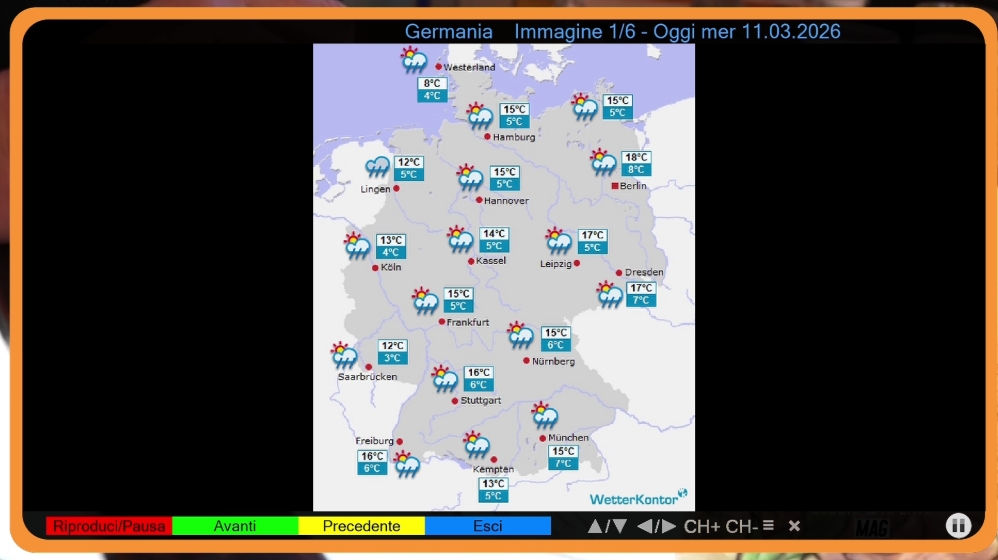
- Wetterkontor – slideshow of regional maps (Europe, Germany, continents)
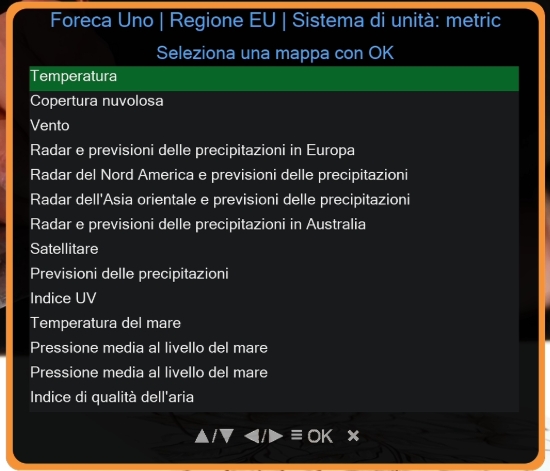
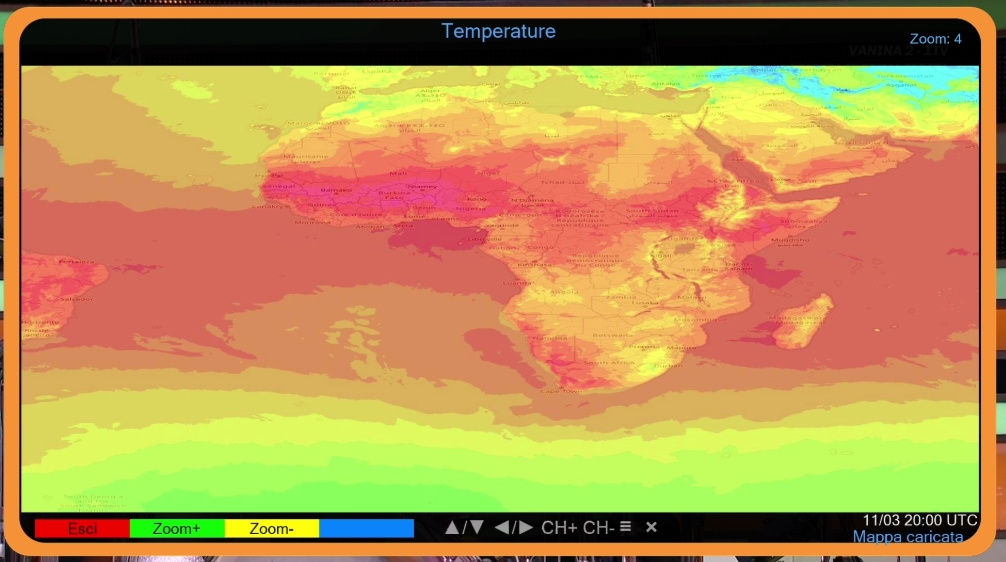
- Foreca Live Maps (API) – temperature, wind, precipitation, clouds, radar
- 3×3 tile grid with zoom in/out and pan (move with arrow keys)
- Multiple forecast times
- Overlay on geographic backgrounds (now supports North America, South America, Asia, Australia, Africa, and world fallback)
- Local tile cache to respect API limits
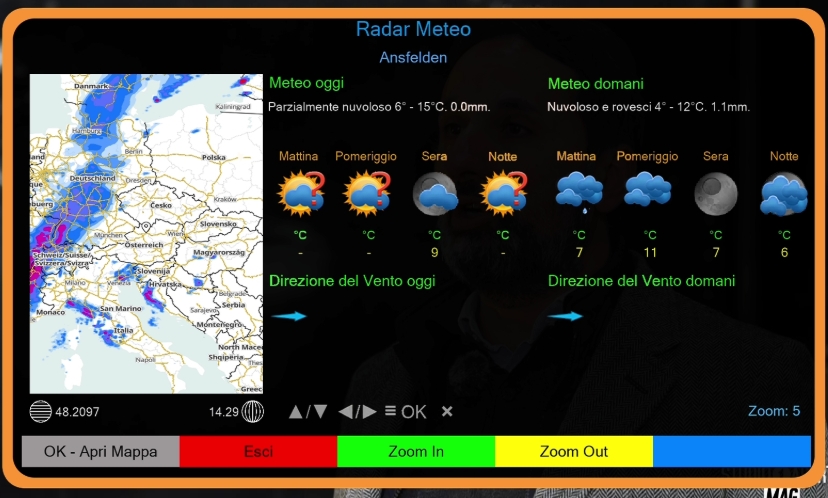
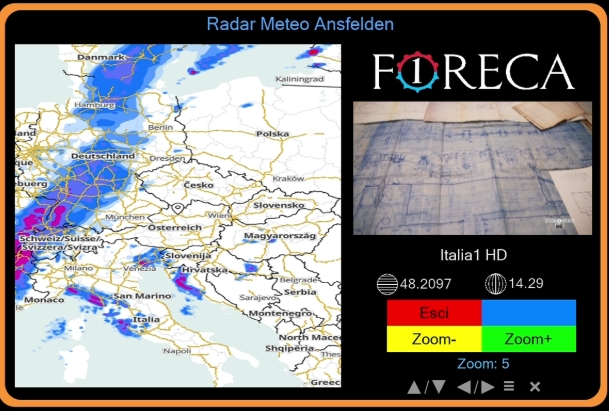
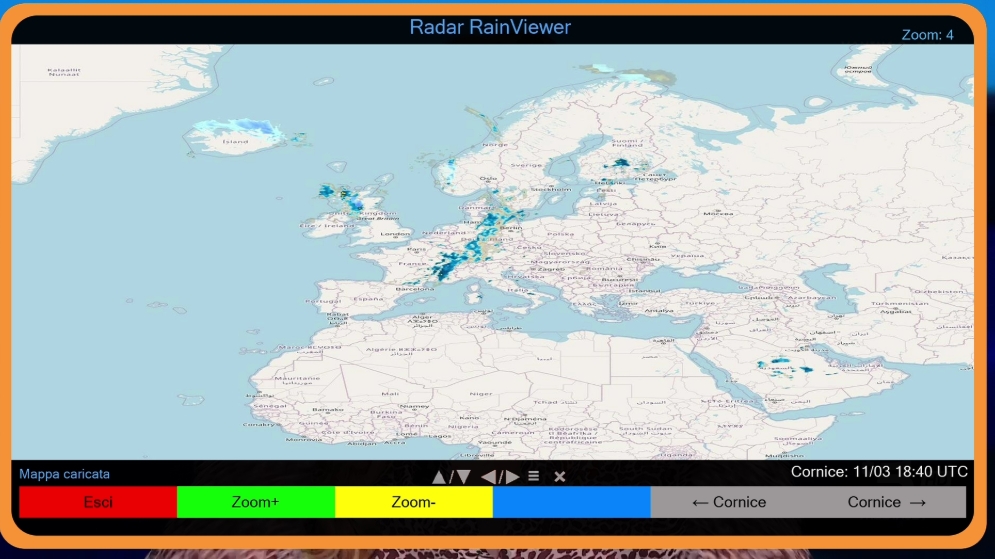
- RainViewer Radar (NEW) – free, no API key required
- Real‑time weather radar for the last 2 hours (10‑minute steps)
- Zoom and pan with arrow keys (step scales with zoom)
- Geographic background from OpenStreetMap tiles
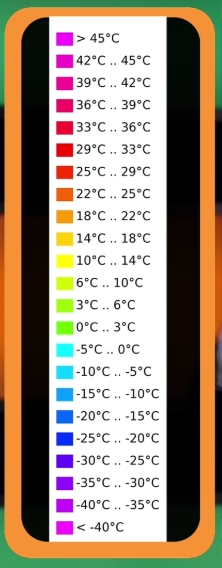
- Ideal for tracking precipitation worldwide – Three viewers (Wetterkontor slideshow, Foreca Live, RainViewer) with zoom, pan, and time control. Each now features a dedicated color legend overlay, togglable via the INFO button, for instant reference of map data.
- Choose between metric and imperial systems
- Customize individual units:
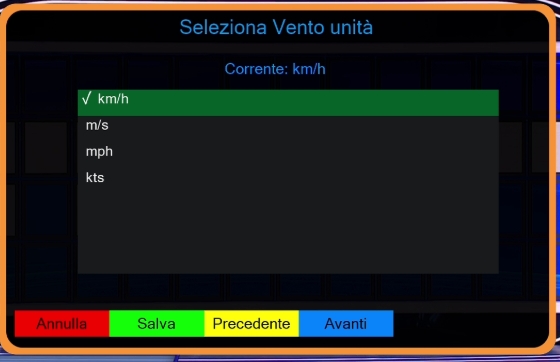
- Wind: km/h, m/s, mph, kts
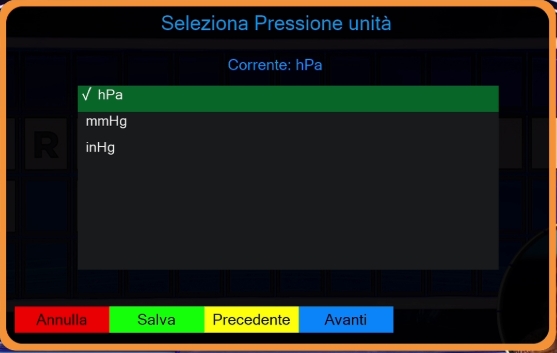
- Pressure: hPa, mmHg, inHg
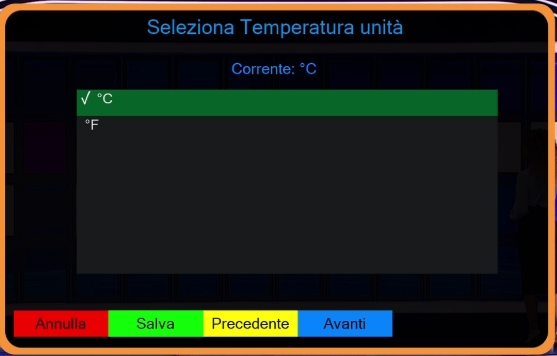
- Temperature: °C, °F
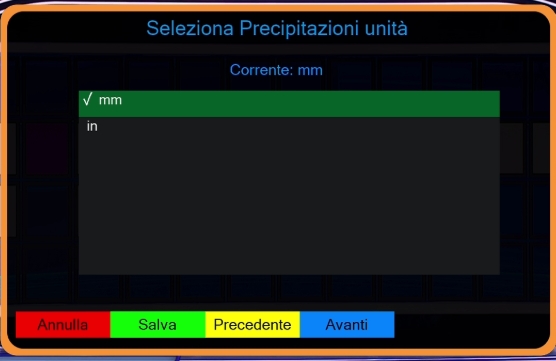
- Precipitation: mm, in
- Changes apply immediately, no restart needed
- Global theme – set a background color once, applied to all screens
- Adjustable transparency for overlays
- Multilingual – built‑in GetText support with Google Translate fallback
- Full remote control navigation – all screens accessible via keys
- Skins for FHD, HD, WQHD – perfect on any screen
- Centralized icon fallback – missing icons show
na.pngto avoid blank spaces
- Python 3 compatible
- Asynchronous downloads (moon, maps, stations)
- Debug mode with detailed logs
- Smart caching (translations, API tokens, map tiles)
- Copy the
Foreca1folder to your Enigma2 plugins directory:/usr/lib/enigma2/python/Plugins/Extensions/ - Set correct permissions:
chmod -R 755 /usr/lib/enigma2/python/Plugins/Extensions/Foreca1 - Restart Enigma2 or the plugin menu to make the plugin visible.
The plugin uses a new_city.cfg file containing the list of supported cities (format: ID/City_Name per line). If the file does not exist, online search is used. You can generate it manually or let the plugin create it automatically during a search.
To enable live maps and API stations, you need a Foreca account (free 30‑day trial, 1000 requests/day).
- Register at https://developer.foreca.com
- Create the file
api_config.txtin the plugin folder:/usr/lib/enigma2/python/Plugins/Extensions/Foreca1/api_config.txt - Insert your credentials:
(change the servers if needed, e.g.
API_USER=your_username
API_PASSWORD=your_password
TOKEN_EXPIRE_HOURS=720
MAP_SERVER=map-eu.foreca.com
AUTH_SERVER=pfa.foreca.com
map-us.foreca.comfor US maps)
An example file api_config.txt.example is created automatically if the main file does not exist.
Note: without these credentials, the plugin still works perfectly using public data.
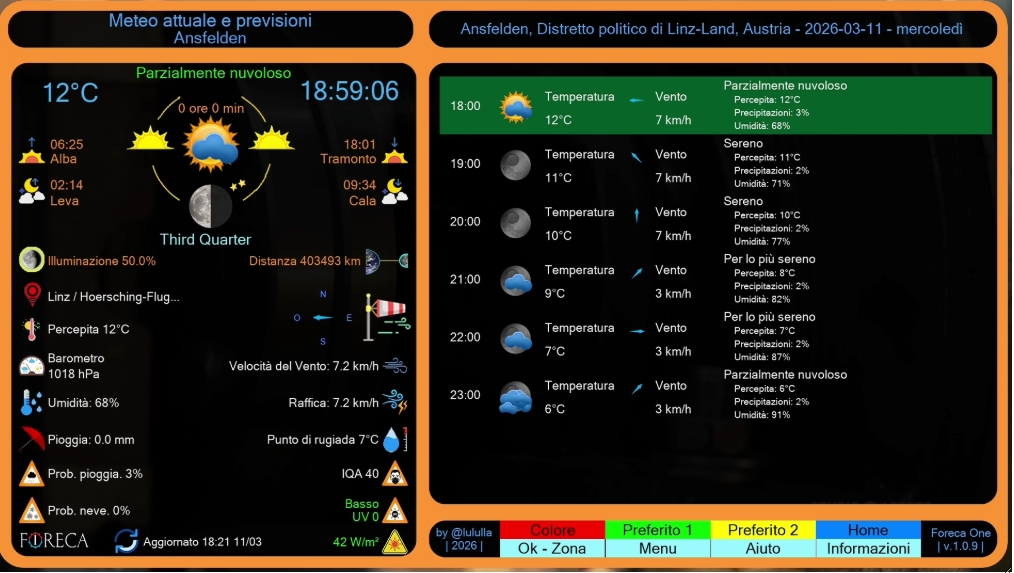
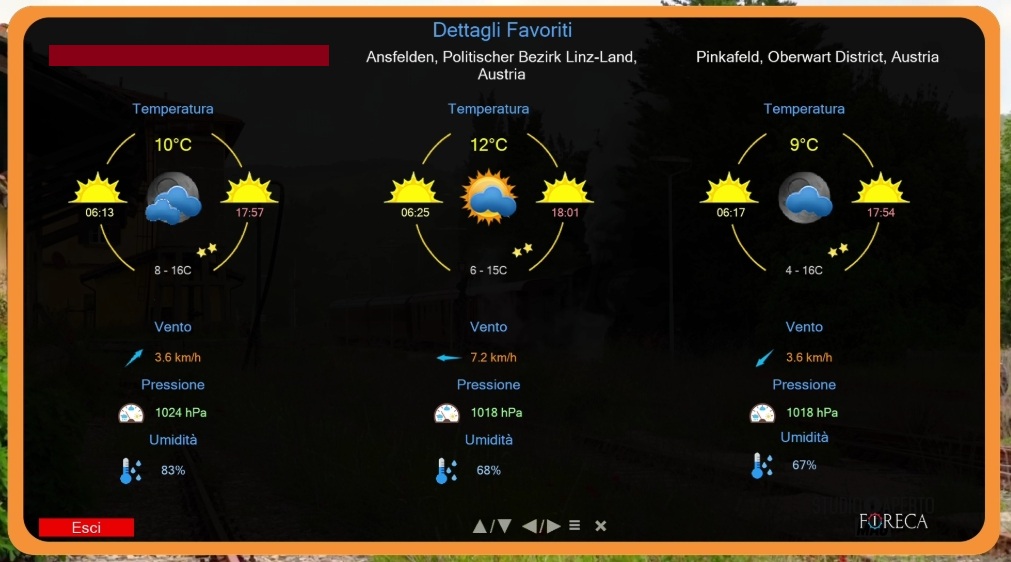
Upon startup, the main screen displays:
- City, date and day name
- Current weather (icon, temperature, description)
- Extended details (feels like, dew point, wind, gusts, rain, humidity, pressure, UV, AQI, probability, update time)
- Sun information (sunrise, sunset, day length)
- Moon phase (icon, name, illumination, distance, rise/set times) – now using precise astronomical calculations
- Nearest observation station (if available)
- Hourly list for the selected day (scrollable with UP/DOWN)
Function keys:
- 0‑9 – jump directly to the corresponding day (0 = today, 1 = tomorrow, … 9 = today+9)
- ←/→ – previous/next day
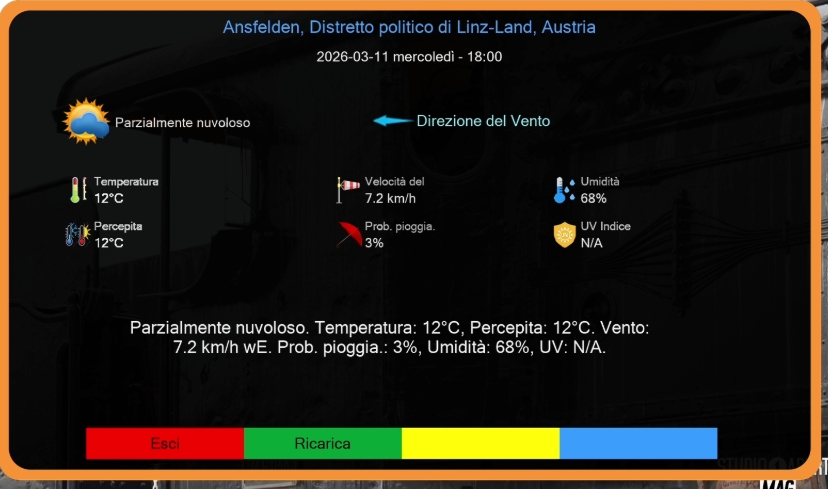
- OK – open today/tomorrow detail screen (with periods and radar map)
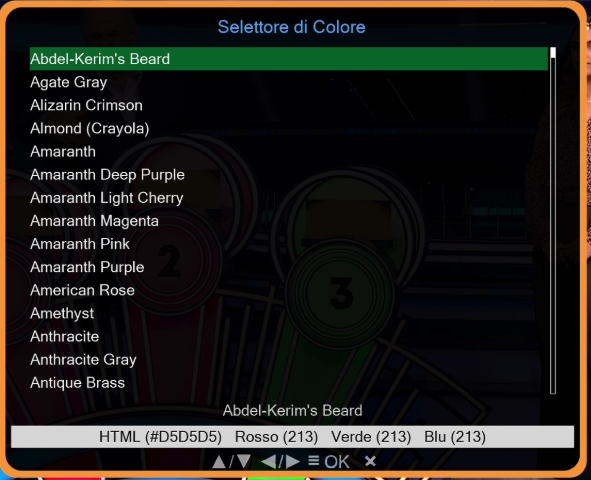
- RED – open color selector
- GREEN – load favorite 1 (
fav1.cfg) - YELLOW – load favorite 2 (
fav2.cfg) - BLUE – load home city (
home.cfg) - MENU – open main menu
- INFO – plugin information
- EXIT – exit plugin (return to TV or plugin menu)
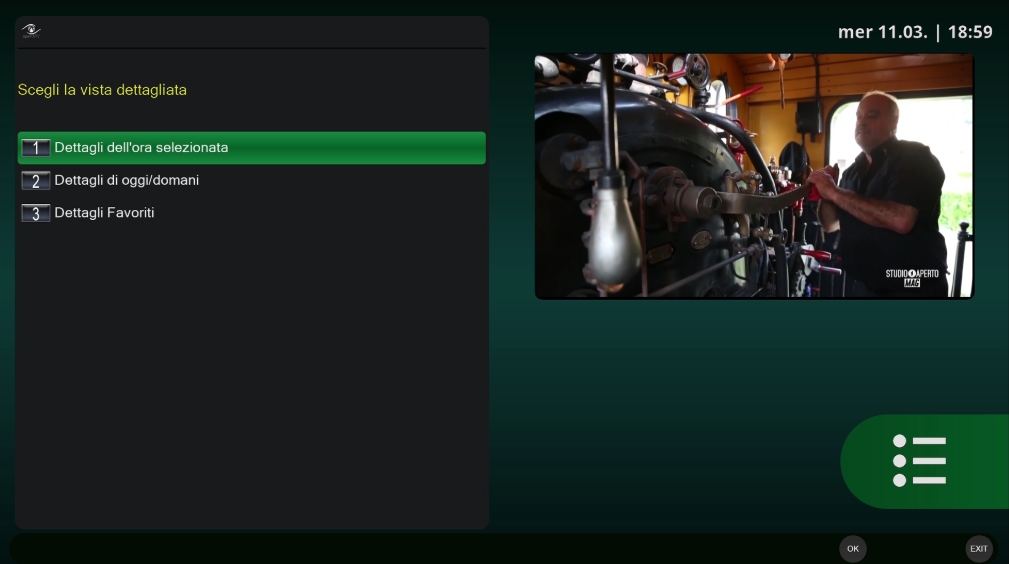
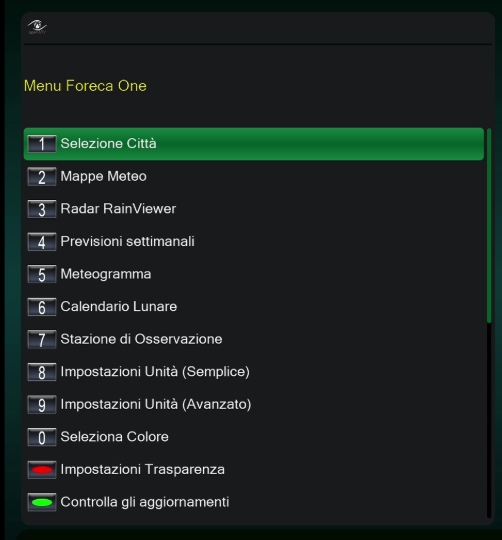
Pressing MENU opens a choice with the following options:
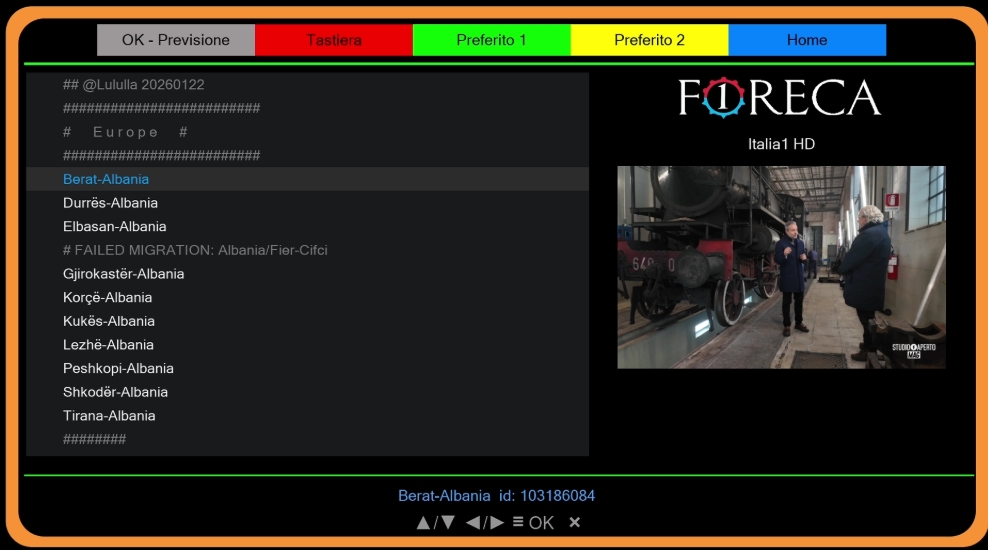
- City Selection – search and assign cities to favorites
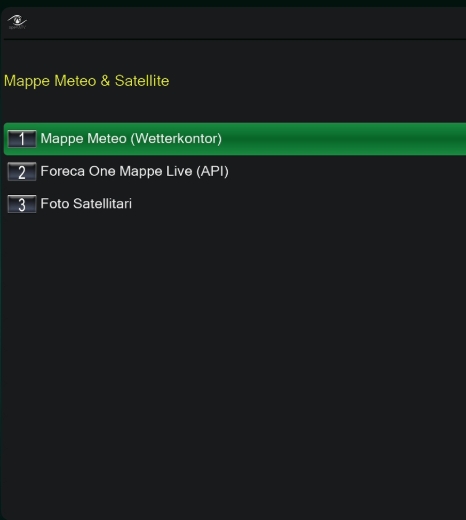
- Weather Maps – submenu to choose between Wetterkontor, Foreca Live Maps, and RainViewer Radar
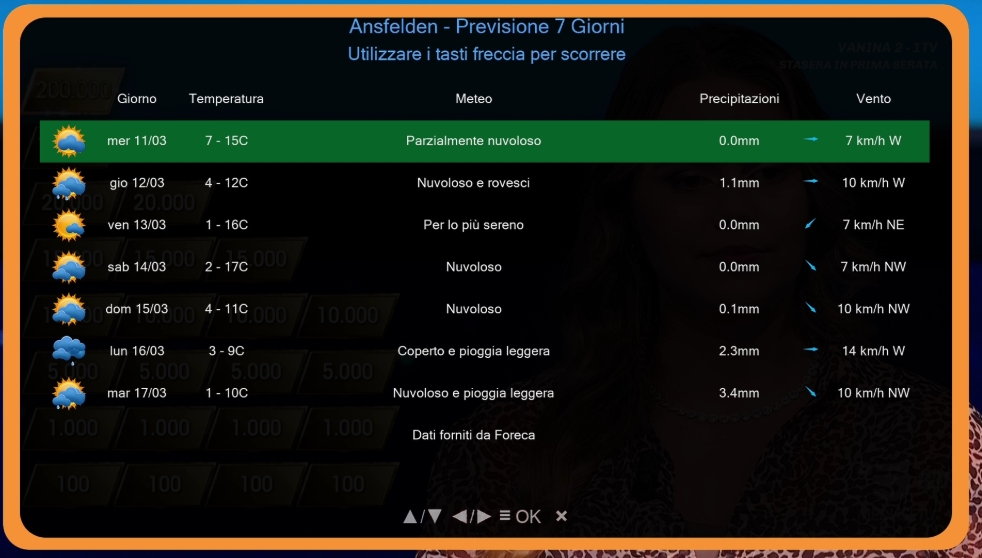
- Weekly Forecast – 7‑day detailed forecast screen
- Meteogram – graphical weather trend
- Station Observations – list of nearby stations
- Lunar Calendar – view all lunar phases for the next 12 months
- Unit Settings (Simple) – quick choice between metric and imperial
- Unit Settings (Advanced) – customize wind, pressure, temperature, precipitation
- Color Selector – change global background color
- Transparency – adjust overlay transparency
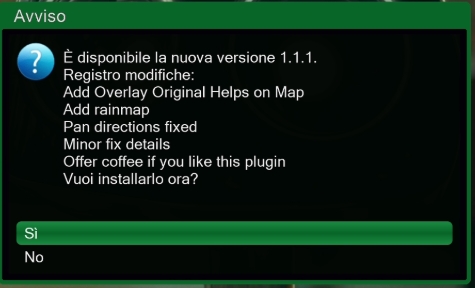
- Check Update – version update from github
- Info – version and credits
- Exit – close menu (return to main screen)
- RED – open virtual keyboard to enter city name
- Search is performed first online (Foreca API), then offline on
new_city.cfgif no results - GREEN – assign selected city to favorite 1
- YELLOW – assign to favorite 2
- BLUE – assign as home
- OK – load city into main screen and close panel
- EXIT – return to menu without changes
Each row contains:
- Abbreviated day name and date
- Min/max temperatures (converted according to chosen units)
- Abbreviated weather description
- Precipitation probability
- Wind speed and direction
Navigation:
- UP/DOWN – move selection
- PAGE UP/PAGE DOWN – jump one page
- OK – open a window with complete details of the selected day
- EXIT – return to main menu
Shows temperature trend (coloured curve), precipitation bars, weather icons and wind for 3‑hour intervals over the next 7 days. Includes temperature and precipitation scales and date markers.
Keys:
- OK/EXIT – close meteogram
Data comes from:
- Authenticated API (if configured)
- Fallback: scraping of Foreca website
For each station: name, distance, temperature, feels like, dew point, humidity, pressure, visibility, update time.
- UP/DOWN – navigate through stations
- OK – show details of selected station (if not already visible)
This screen displays a table of all lunar phases for the next 12 months, starting from the next month. For each phase you see:
- Month and year
- Icon of the moon phase (using the same 101‑icon set as the main screen)
- Phase name (e.g. "Full Moon")
- Day of the month
- Time (in UTC)
Navigation:
- UP/DOWN – scroll through phases
- PAGE UP/PAGE DOWN – jump one page
- OK – show detailed information: exact date/time, illumination percentage, Earth‑Moon distance
The calculations are performed offline using precise astronomical algorithms (Meeus), so no internet connection is required. The data is consistent and accurate for any location (geocentric).
The Weather Maps submenu offers three options:
- RED – play/pause
- GREEN – next image
- YELLOW – previous image
- BLUE – exit
- UP/DOWN – increase/decrease slideshow speed
Requires valid credentials. Shows list of available layers (temperature, wind, precipitation, clouds, radar). After selection, the viewer opens:
- ←/→ – pan left/right (step scales with zoom)
- ↑/↓ – pan up/down (step scales with zoom)
- PAGE UP/PAGE DOWN – change forecast time (if available)
- GREEN – zoom in
- YELLOW – zoom out
- INFO – toggle the color legend overlay for the active map layer
- RED/EXIT – close
Note: without credentials, this menu item is hidden.
Free, no API key required. Shows the last 2 hours of weather radar data with 10‑minute steps. The viewer includes:
- ←/→ – pan left/right
- ↑/↓ – pan up/down
- PAGE UP/PAGE DOWN – change time frame
- GREEN – zoom in
- YELLOW – zoom out
- INFO – toggle the color legend overlay (for precipitation intensity)
- RED/EXIT – close
- Geographic background from OpenStreetMap tiles for perfect alignment.
Choose between metric (Celsius, km/h, hPa, mm) and imperial (Fahrenheit, mph, inHg, in) with UP/DOWN and confirm with GREEN.
Customize individual categories:
- Wind: km/h, m/s, mph, kts
- Pressure: hPa, mmHg, inHg
- Temperature: °C, °F
- Precipitation: mm, in
Navigate categories with YELLOW (next) and BLUE (prev). Inside a category, select the unit with OK (a checkmark appears). Save all with GREEN.
After saving, the main screen updates immediately with the new units.
- Color Selector – lists predefined colors (from
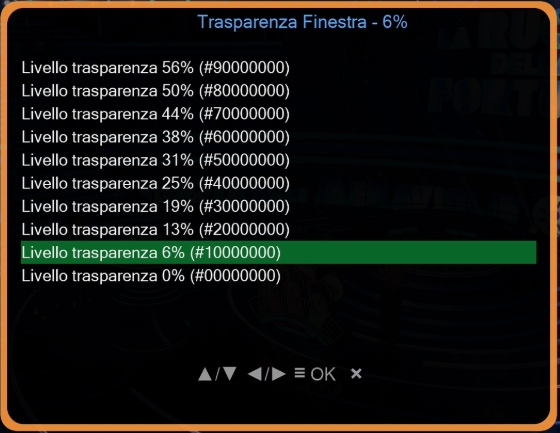
color_database.txt). Use UP/DOWN to move, OK to confirm. The color is applied to all screens (global theme). - Transparency – lists levels from 6% to 56%. OK confirms, change is visible immediately.
Checks if an update has been released online and runs it.
Shows version, authors and credits. Press OK or EXIT to close.
- Obtain username and password from Foreca Developer (free trial).
- Create the file
api_config.txtin the plugin folder with the following content:API_USER=your_username API_PASSWORD=your_password TOKEN_EXPIRE_HOURS=720 MAP_SERVER=map-eu.foreca.com AUTH_SERVER=pfa.foreca.com
- (Optional) Adjust parameters as needed (e.g.
MAP_SERVER=map-us.foreca.comfor US maps).
An example file api_config.txt.example is created automatically.
- Check internet connection.
- Verify that the selected city is valid.
- Look at debug files in the plugin's
debug/folder.
- Online search might be temporarily unavailable. Make sure
api.foreca.netis reachable. - Ensure
new_city.cfgexists and contains at least a few cities. - Try a more generic term (e.g. “Rome” instead of “Rome, Italy”).
- Check that
api_config.txtexists and contains correct credentials. - Verify that your Foreca account has access to map APIs.
- Enable debug (
DEBUG = Trueinplugin.py) and examine logs.
- Make sure you are pressing UP/DOWN, not numeric keys (which change the day in the main screen).
- Verify that the skin has a
listwidget with adequate dimensions.
- This issue has been fixed in recent versions. Check that the
units_closedcallback is present inplugin.pyand that the unit screens returnTrueupon saving.
- The function
apply_global_thememust be called in every secondary screen (already done for all main screens). If a custom screen lacks thebackground_plateandselection_overlaywidgets, the theme will not be applied.
- The plugin now uses high‑precision algorithms (Meeus). If you still suspect errors, enable debug and check the calculated Julian Day vs. official sources.
- The tiles are transparent when no precipitation is detected. Try moving the map to a different area or wait for a rainy day.
- If the background map does not appear, check that the OpenStreetMap tile URL is reachable.
- Original design and idea: @Bauernbub
- Modifications and further development: @Lululla
- Contributions: Assistant (API refactoring, meteogram, new data integration, extensive debugging, menu navigation, station scraping, lunar calendar, advanced units, global theme, DailyForecast fixes, map improvements, RainViewer integration, pan in live maps, centralized icon fallback)
Thanks to @Orlandox and all friends who provided suggestions and tested the plugin.
This project is licensed under the GNU General Public License v3.0. See the LICENSE file for details.
Enjoy the weather, rain or shine! ☀️🌧️
© Lululla 2026